Operator workbench
- The section rail
- The path
- Settings
- Appearance
- Why a command is unavailable
- Signing in
- The Overview landing page
- Command palette
- Table: the toolbar
- Event journal as an alarm panel
- Transmission rules
- Schematic display
- Inspector
- Administration
- Nodes
- Translation status
The client window is laid out as an operator workbench: the section rail on the left, the context strip along the top, workspace tabs in the middle, the selection-driven panels on the right and the status strip at the foot. All of those regions are described below.
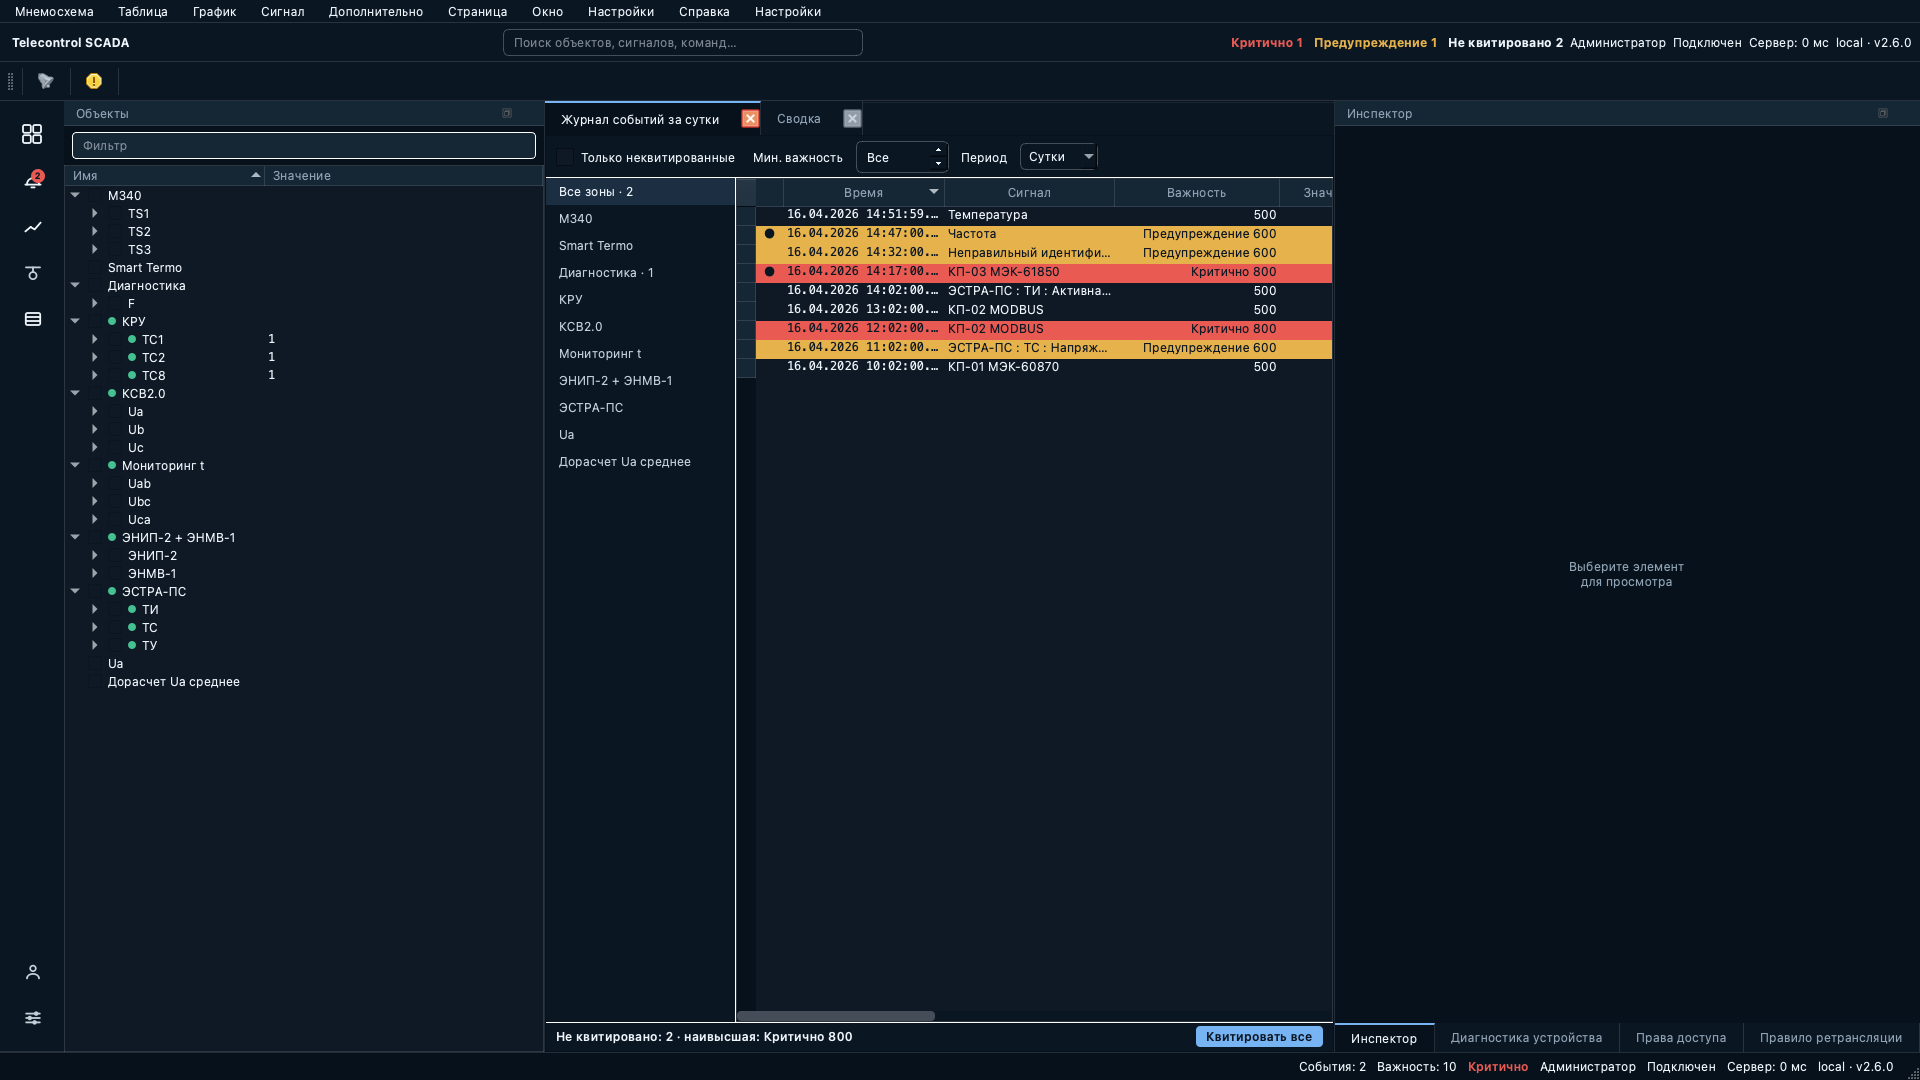
The workbench regions:
- Section rail (left) — three zones: the sidebar modes, the profile’s pages on their own band, and the pinned commands at the foot. Described below. The unacknowledged-events count lives in the context strip.
- Context strip (top) — the path, the search/command field and the alarm state: severity tiles (“Critical N”, “Warning N”, “Unacknowledged N”, highlighted while alarms are active; with more than ten unacknowledged alarms the counters give way to a single “Alarm flood” indicator). The user, the connection state and the server address are not shown here — they appear in the status strip only.
- Object explorer — the object tree with a “Filter” field and quality dots: green — good, red — bad, blinking yellow — the object has an unacknowledged event. See Reading values and colours. The tree starts at its content: the pane’s own title already names it, so no separate root row is drawn. The same holds for the Devices, Files and Nodes panes.
- Workspace tabs — the open windows (journal, tables, graphs, schematic displays) as editor-style tabs.
- Right-hand panels — Inspector, Device diagnostics, Access rights, Transmission rule; they fill from the current selection.
- Status strip (bottom) — the event summary, the minimum severity, the highest active severity, the user and role, the connection state, the server round-trip time, and the server address and version. This is the only place the user and the connection details are shown.
The server round-trip time is the age of an outstanding ping, so a growing number means no answer is arriving. Past 3 seconds the cell gains a “no response” marker and a warning is added to the journal: either the connection has degraded, or the client itself has stopped running — the operating system can suspend a client whose window is not visible, which halts data and events, not only the display. A separate event reports when the server answers again.
By default the appearance follows the operating system; dark, light and high-contrast variants are also available (Settings → Settings… → Colour scheme). Values and timestamps in all tables render in a monospace font. Dialogs — login, control and manual input, limits, password change, period selection, object creation, About — follow the same theme.
The section rail
A narrow strip down the left edge of the window, in three zones. It never opens a workspace tab — each zone answers a different level of navigation.

- Sidebar modes (top)
- Select what the sidebar shows: Objects (the object tree and portfolios), Devices (the hardware tree), Files (files and favourites), Nodes (the address space) and Administration (the administrator's section list). A mode changes only what fills the sidebar — it never opens a tab and never changes the page. Nodes and Administration are for administrators only: for everyone else those buttons are hidden, not disabled.
- Pages (middle, on their own band)
- The profile's pages; each one replaces the whole workspace. A button
carries the page's chosen icon, or its position when no icon is set; the title
and the position are both in the tooltip (
2 · Alarms), because neither fits a 52px button. "+" creates a page. The band behind this group is what keeps the active-page marker from reading as a mode marker: a mode and a page are active at the same time, and the two markers are drawn alike. - Pinned commands (bottom)
- Settings opens the settings; Users opens the account list. A pinned command opens in the current page, the way any window does, so the page marker stays lit. Users is for administrators only and is hidden for everyone else.
A page can be moved by dragging: a line between the buttons shows where it will land. The gap between two buttons and the area below the last one are both valid drop positions.
Right-click a page button for its menu:
- Open page
- Switch to it. Absent when the page is already open.
- Rename…
- Set the title. Acts on the current page.
- Duplicate
- Copy the page with its layout and windows, and switch to the copy. The copy is taken after saving, so it carries what is on screen rather than what was last saved.
- Move up / Move down
- Reorder without dragging. Up is unavailable on the first page, down on the last.
- Icon
- Choose the page's icon; "None" restores the position number.
- Delete page
- Delete the page and its layout. Kept apart from the other items so it is not reached by habit.
The rail’s markers are a projection of real state, not a memory of the last click. If the open panes match no mode — because one was closed by hand, say — the mode marker clears rather than claiming something that is not there.
The path
The left of the context strip states where the workspace currently is: page → view → selected object. It is the only region that names the object: the section rail names the mode and the page, the tab names the view, and neither says what the view is pointed at.
The ends of the path — the page and the object — are drawn in the foreground weight and the middle steps are quiet. An empty step is dropped rather than left as a dangling separator, so a view with no selection simply has no third step. A step repeating the one before it is dropped for the same reason: a view named after the object it is pointed at would otherwise print that name twice. No object is named for a multiple selection.
A long path is elided against the width the layout actually grants, so it follows the text size set in the operating system.
Settings
Settings → Settings… opens the client’s settings. The Settings button at the foot of the section rail opens the same thing — one command behind both, so the settings live in exactly one place.
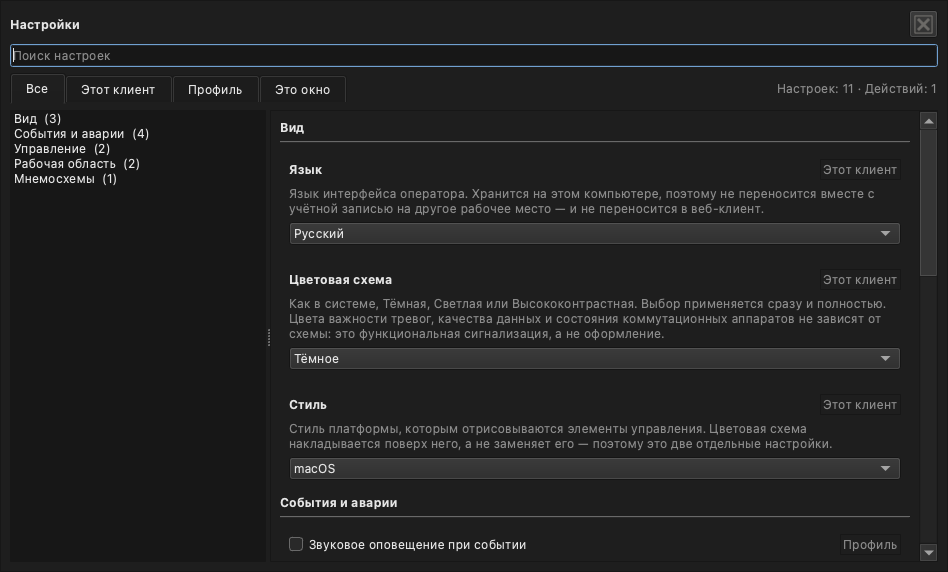
The settings screen opens over the main window: a search field along the top, the categories down the left with the number of settings in each, and scope tabs above the list — All, This client, Profile, This window.
Every setting carries a description and a scope label, so it is visible which ones are kept on this computer and which travel with the account in the profile. Settings apply immediately: there is nothing to confirm, and the screen closes from the close button in its header. For an account with rights “0 — Executive / viewer” the server does not save the profile: the Client reports “Failed to save the profile to the server; it is kept on this computer only”, and the settings stay on that workstation.
| Category | Settings |
|---|---|
| Appearance | Language, Colour scheme, Style |
| Events & alarms | Sound Alarm on Event, Show Events on Arrival, Hide Events on Acknowledge, Flash Main Window on Event — see Alarm annunciation |
| Control | Control Confirmation, Control Success Message — see Control |
| Workspace | Toolbar (hidden by default), Status Bar |
| Displays | Show Modus topology; the Open Displays Folder action |
The current version has no switch for spoken announcements on the settings screen — see Spoken announcement.
Appearance
The appearance is chosen in Settings → Settings…, from the Colour scheme list — next to Style, and behaving the same way: the choice applies immediately and in full, with no restart.
- Follow system
- Whichever appearance — light or dark — the operating system is set to. The default; a desktop appearance switch applies immediately.
- Dark, Light, High contrast
- An explicitly chosen appearance, which does not follow the operating system. Dark is the recommended control-room setting.
The choice is saved when the client exits and restored on the next start.
Alarm severity, data quality and switchgear state keep their colours whatever the appearance: those are safety signals, and their values are the same in every scheme.
Presetting the appearance
The appearance choice is kept on the computer, in the operating-system user’s
settings: on Windows in the registry, under
HKEY_CURRENT_USER\Software\Telecontrol\Telecontrol SCADA Client\Ux. The
values can be set in advance — when rolling the client out to many machines,
say.
- Ux/Theme
- Appearance variant:
system(default, follows the OS),dark,light,hc(high contrast). Mirrors the Colour scheme list. - Ux/StyleSheet
- When
false, theming is limited to the colour palette, without the global stylesheet — for configurations with embedded, style-sensitive components. Not shown on the settings screen.
Why a command is unavailable
When a context-menu command is disabled, hovering it shows a tooltip with the reason — “The signal has no output channel” for Control…, say, or “No event shown here is waiting to be acknowledged” for Acknowledge All in the event journal. That makes it clear whether the command is blocked by the object’s state or simply does not apply to the current selection.
Commands that are unavailable outright (without the Control privilege, for example) are not listed in the menu at all; for a selected object the Inspector shows that reason instead.
Signing in
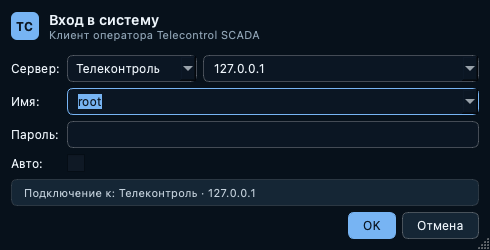
The sign-in window carries only what signing in needs: the server, a user name, a password and a “Sign in automatically next time” box. The window title names the task and the content does not repeat it.
The OPC UA security settings — the mode, the client certificate and the private key — sit behind a “Security and certificates” disclosure. It is shown only for a protocol that supports them, and it opens by itself when any of them already carries a value: this is configuration set once, not a credential supplied at every sign-in.
The “Connecting to:” line below the fields appears only in a build carrying one protocol, where it is the only place the protocol is named. When the protocol is a field of its own, the line would repeat what is already written above it, so it is not drawn.
The Overview landing page
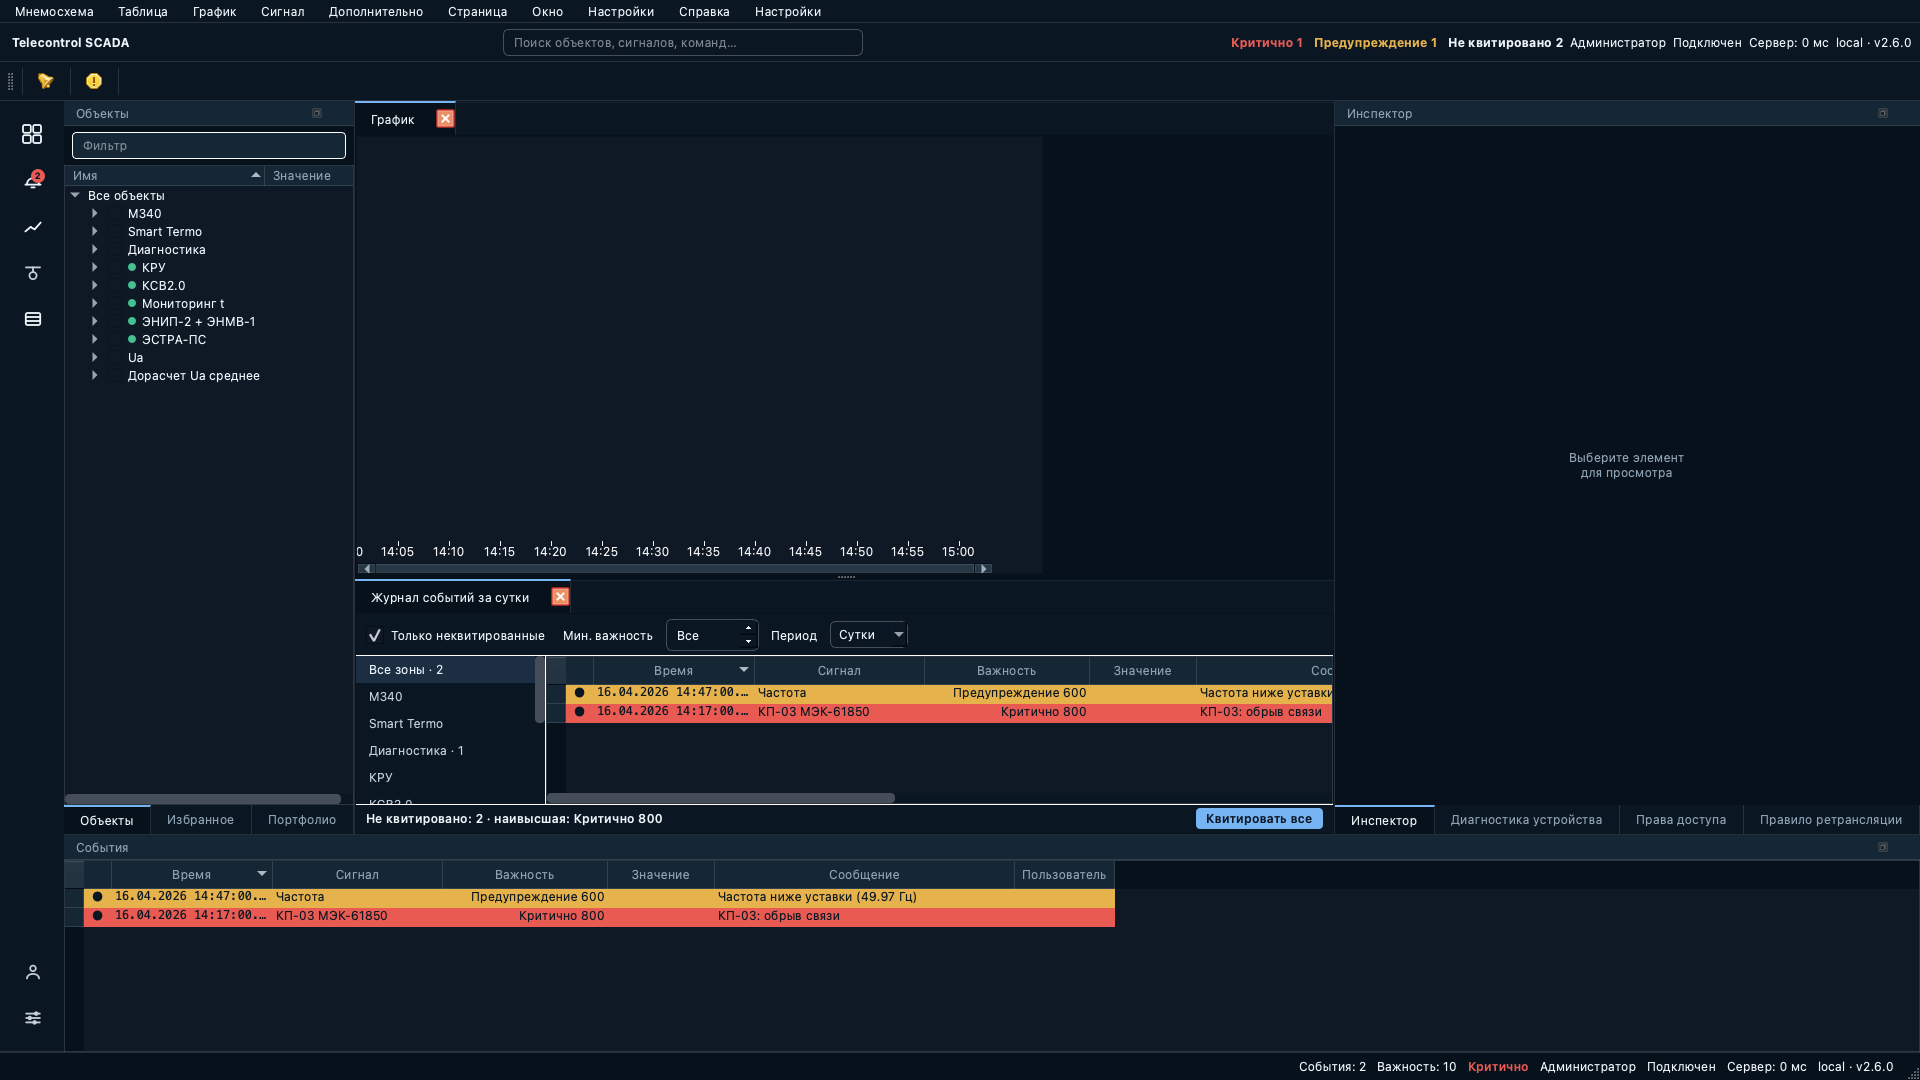
A fresh profile (no saved pages) opens on the Overview page — the operator’s working screen: the sidebar with the object tree on the left, a dominant trend on top (about two thirds of the screen) with the active-alarm table under it (the event journal in current mode, unacknowledged events only), and the Inspector on the right.
The sidebar carries the “Objects” mode’s panes: “Objects” (the object tree with its filter and quality dots) and “Portfolio”. The tabs along the bottom of the panel switch between them; “Objects” is the one open by default. Other modes’ panes are absent from the page — “Favorites”, for one, belongs to the “Files” mode, and the sidebar is conformed to whichever mode is selected. The severity summary stays visible in the top-bar tiles throughout. The trend is empty until the operator adds signals to it; the page layout is saved in the profile as a regular page.
Command palette
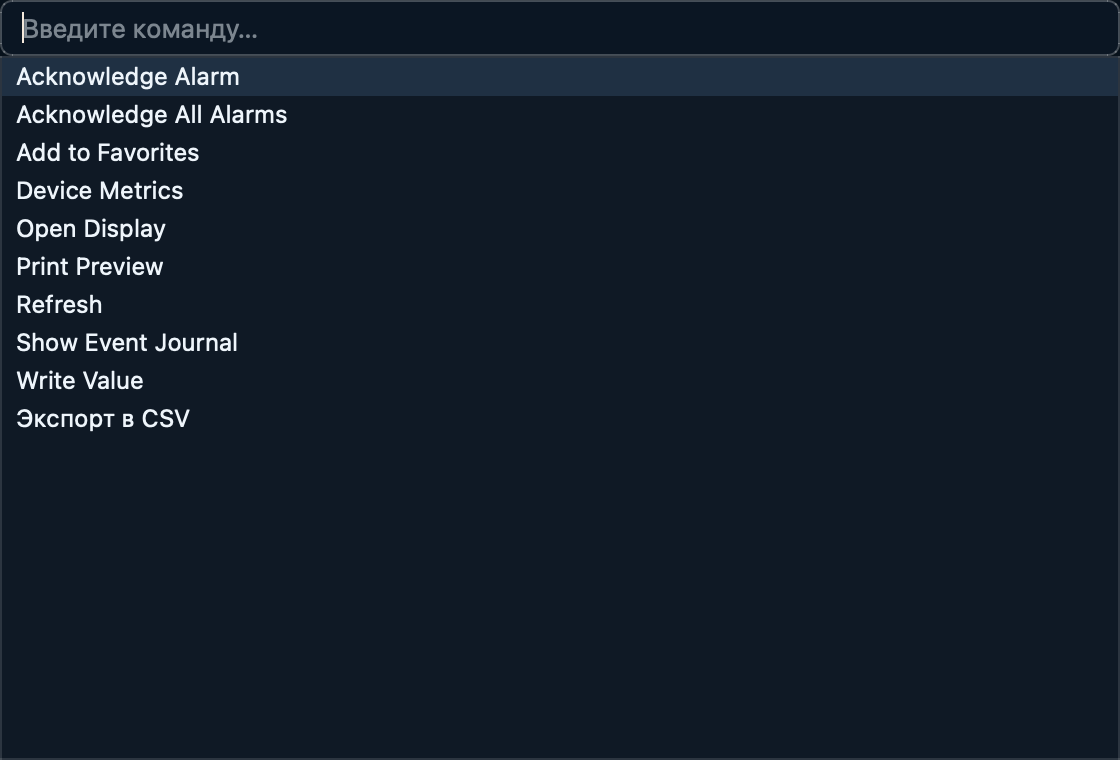
Ctrl+K (or clicking the search field in the context strip) opens the command palette: an input line filtering as you type, every registered command and window-open action, plus signal search by name — a chosen signal opens in a table. Enter runs the selected entry.
Table: the toolbar
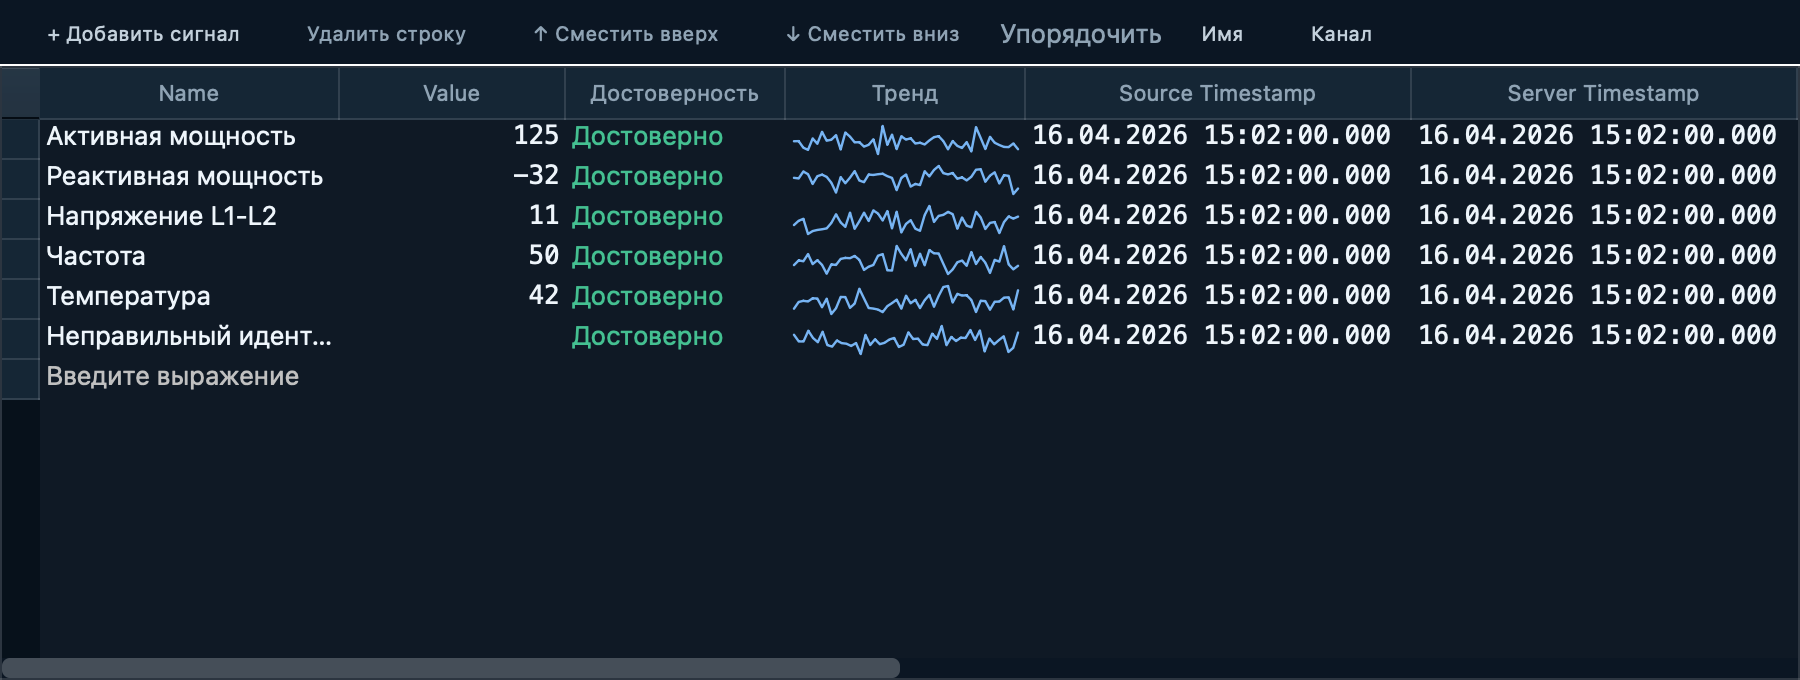
The Table window carries a toolbar above the grid:
- + Add signal
- Opens the editor on the table's trailing row ("Enter expression") to type an object alias or a formula.
- Delete Row, Move Up, Move Down
- Actions on the selected rows — the same commands as the context menu. Commands that do not apply to the current selection (for example, with no row selected) are greyed out.
- Sort: Name / Channel
- The row sort key (see Sorting); the active key is highlighted.
- To graph, CSV, Print
- Opens a graph for the selected object, exports the table to CSV, prints. These buttons appear when the corresponding command is available in the current session and the window is active.
In addition, values and timestamps in all tables render in a monospace font — digits stay aligned and do not shift as values update — and two columns appear next to the value: “Quality” with a textual quality flag, and “Trend” with a mini-graph of the value over the last hour, updating live.
Event journal as an alarm panel
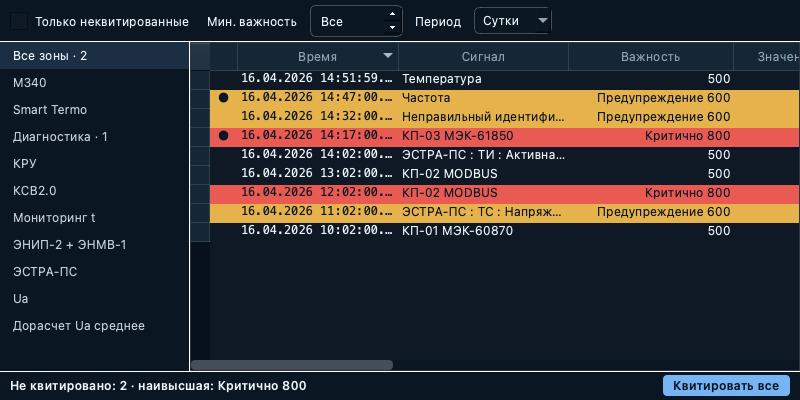
The event journal reads as an alarm panel:
- Row colour is severity. An alarm row is coloured by its severity (red — critical, amber — warning); routine events stay unfilled so the eye is drawn only to alarms. Acknowledging does not change the row’s colour.
- Pending dot — the leading column marks every unacknowledged row with a dot, and such a row’s “Acknowledge Time” cell reads “— pending —”. The dot carries the acknowledgement state and the row colour carries the severity, so a pending critical alarm still reads red. The dot stays out of exports and printouts — it is display chrome, not part of the record.
- Named severity — the “Severity” column names the alarm band next to the number (“Critical 800”, “Warning 600”).
- Areas sidebar — to the left of the journal, “All areas” and the top-level object areas; an area with unacknowledged events carries their count. Selecting an area filters the journal to it; the other areas keep their counts meanwhile.
- Footer strip — below the journal, a summary of the displayed unacknowledged events (“Unacknowledged: N · highest: Critical 800”; a quiet journal reads “No unacknowledged events”) and an Acknowledge All button running the same command as the context menu. The button acknowledges only the events the journal shows — after the selected area, the minimum severity, the object list and the unacknowledged-only filter; events the filters hide stay unacknowledged. The button is disabled when nothing shown is waiting to be acknowledged.
A live alarm that also appears in the read history shows as one row — the journal does not duplicate it with its historical copy.
Transmission rules
Transmission forwards SCADA objects to upper-level systems. Every destination device has its own rule table, and one rule binds one SCADA object to one information-channel address in the remote system. The mechanism is described on the Architecture page.
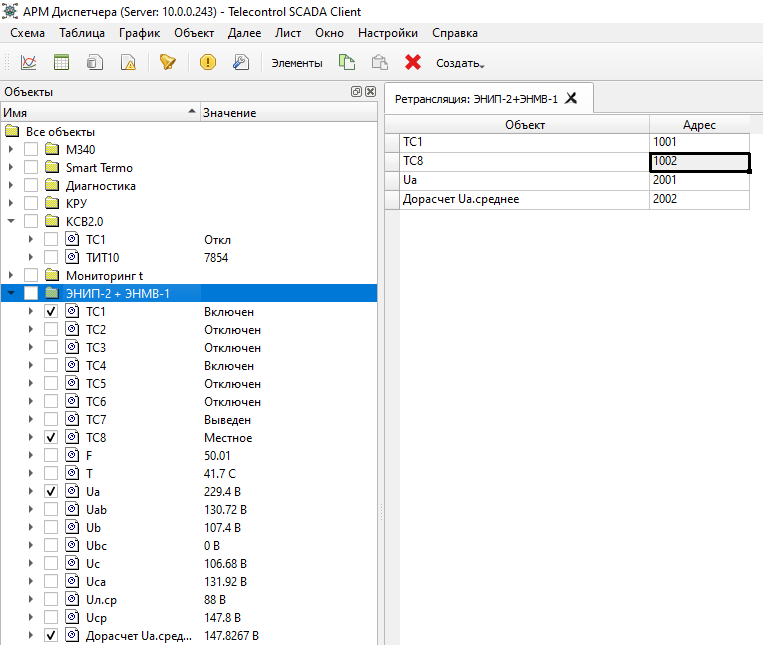
Opening the table
The Transmission table command opens the rule table of the selected device. It is available when the selection is a destination device (not a communication link) and the user holds the configure permission. The destination device itself is created in the configuration like any other device — the command opens its table, it does not create the device.
The destination rail on the left lists every retransmission destination device with its rule count; picking a destination switches the table to its rules, and the count updates as rules are added or removed.
Protocol
A rule’s protocol follows from the destination device’s type and is not chosen separately. Modbus, IEC 60870-5-104 and IEC 61850 are supported. A device whose type declares no transmittable items does not appear in the destination rail.
Creating a rule
The table is filled from the object tree: tick an object and a rule for it appears in the table under the Object column; clearing the tick deletes the rule. The ticks in the tree always match the contents of the open table.
Each new rule needs a destination address, typed directly into the table’s Address column. The Object column is not editable — the source is set only by the tick in the tree.
Selected rules are removed with the Delete command, which requires the delete-node permission.
The Transmission-rule panel
Selecting a rule fills the Transmission-rule panel on the right:
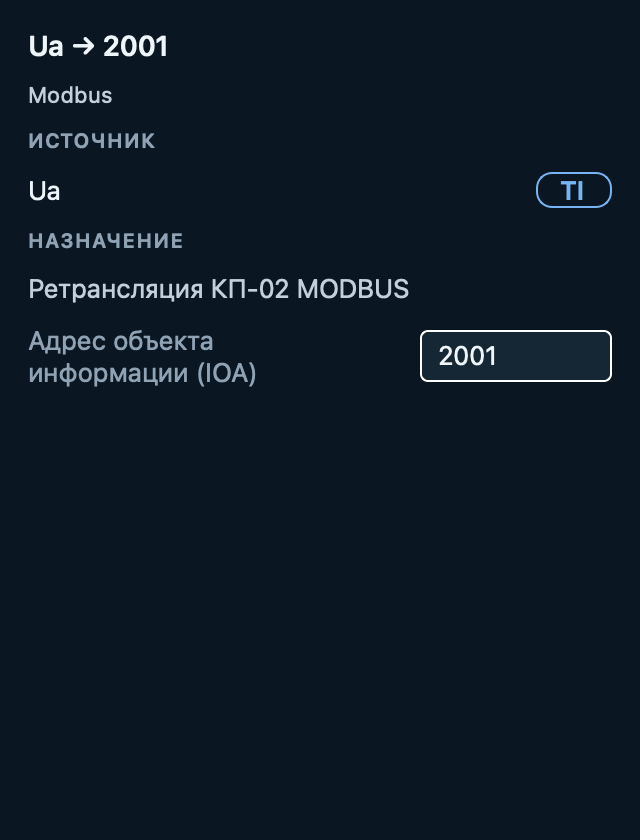
The panel shows the source signal (with its TS/TI type tag), the destination device, the protocol and the address (IOA); the address is editable behind Revert/Apply when a write path is available.
What happens at run time
The rules are executed by the Server, not the client — the client only edits the table. The Server then sends the listed objects’ values to the remote system over the destination device’s protocol, and relays control commands arriving from the remote system at those addresses back to the equipment. Table changes take effect without restarting the client.
Schematic display
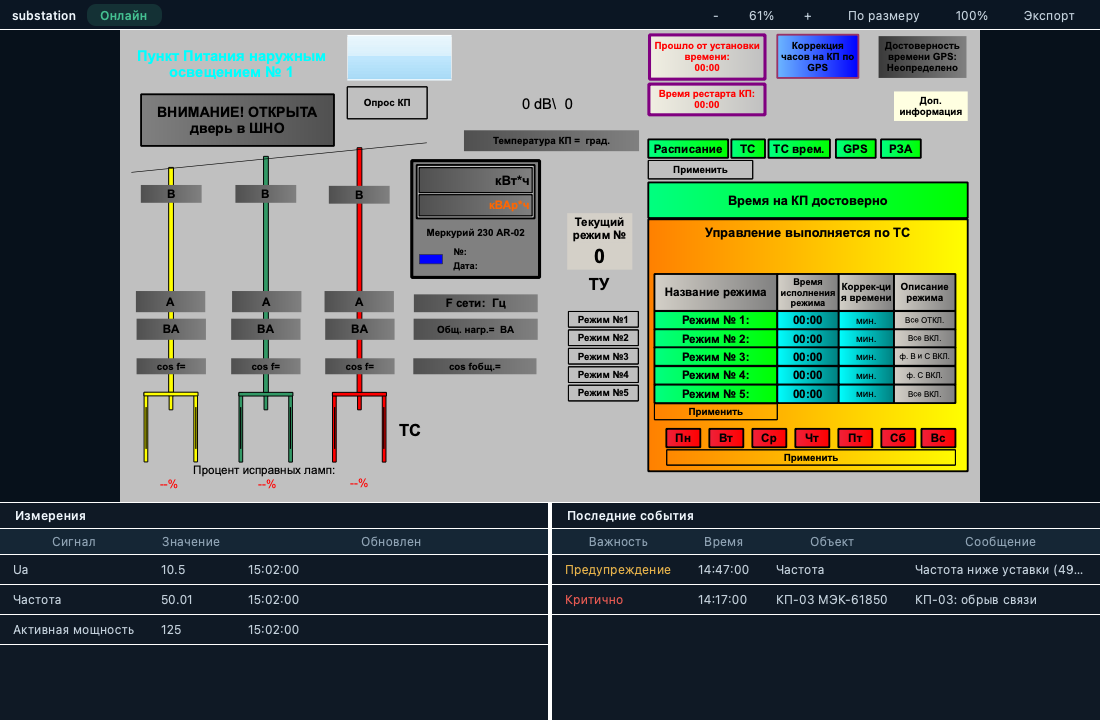
The schematic (single-line) display window carries a toolbar (a “Live” indicator, zoom / fit / 100% / export) and two bay strips below it: “Measurements” — the selected signals’ values with their update times — and “Recent events” — the active (unacknowledged) alarms with their severity, time, object and message. The diagram geometry is unchanged.
Inspector
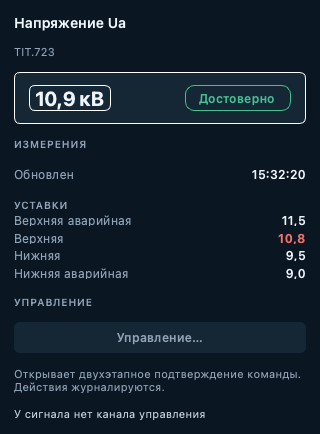
The Inspector panel (on the right) reflects the active window’s current selection:
- the object’s name and its address — a node identifier or a formula;
- the current value in large type with its quality flag (“Good” / “Bad”);
- the time of the last update;
- the signal’s limits — every configured band (“HiHi”, “Hi”, “Lo”, “LoLo”). The band the current value has crossed is coloured and labelled, so it is clear which limit tripped. The section is hidden for signals that configure no limits;
- a Control… button that opens the control dialog. When control is unavailable, the reason appears under the button: the object cannot be controlled (a computed expression or a folder, for example), the signal has no output channel, or the session lacks the Control privilege.
Selecting a table row — including a formula row — fills the Inspector; the value keeps updating while the row stays selected. Clicking an element on a schematic display selects it in the Inspector as well.
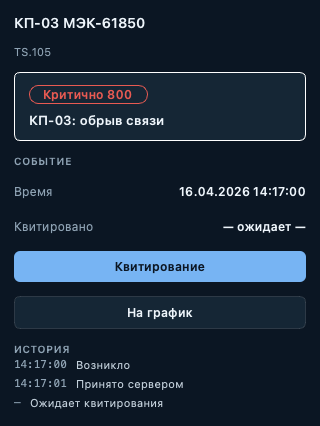
Selecting a row in the event journal shows the event card in the Inspector: the source and its address, the severity (band name and number), the message, the event time and the acknowledgement state (“— pending —” while unacknowledged). The Acknowledge button runs the journal’s own acknowledge command and is disabled for already-acknowledged events. The To graph button opens a graph of the event’s source, so you can jump from an alarm message straight to the signal’s trend. The button is disabled when the event’s source could not be resolved.
Below that, the “History” section shows the event’s own lifecycle: when it was raised, when the server received it (that row appears only when delivery lagged, so the gap shows the delay) and when it was acknowledged. For a pending event the last row — “Awaiting acknowledgement” — carries no time.
Series
When a chart series is selected, a Series section appears below the element card — how that line is drawn:
- the colour palette, one swatch per colour; the series’ current colour is ringed, and clicking another swatch recolours the line. It is the one field in the section that writes.
- “Own pane” — whether the series has a graph pane to itself
- “Show dots” and “Stepped” — how the line is drawn
Those last three are read-outs rather than switches: the graph window owns these modes (see Graph).
The section belongs to the selection, not to the panel: it disappears with the selection, so another object’s card is never shown carrying the previous view’s series.
Administration
The activity bar carries an Administration mode — a fifth one after Objects, Devices, Files and Nodes. It is available only to an account holding the configure right: without it the mode is not shown at all, rather than shown and disabled.
Its explorer lists the administrative windows: Users, Roles, Password policy, Audit log, Databases, Formats, Simulated Signals. A window missing from the installation, or one this session may not open, is not offered.
Users
The Users window reads the server’s standard account list and shows, for each account: its name, description, roles, and whether it is enabled. A disabled account cannot log in.
The Roles column is the permission model: the server grants rights by role. An account may hold several roles at once, and their permissions combine. “None” means the account holds no role — it can log in and nothing more; “No data” means the role list could not be read, which is not the same thing.
Roles
The Roles window lists every role on the server together with its members. The Type column distinguishes standard roles, which cannot be deleted, from custom roles created in this installation. The window is read-only: changing a role’s membership is a privileged operation performed on the server.
Password policy
The Password policy window shows what the server requires of a new password: the permitted length, the required character classes, and the written description of the rule configured in this installation. These are not client settings — they are the rules the server itself validates against.
The same rules apply when changing a password: the dialog warns about a mismatch before sending the request, but the server always makes the final decision.
Setting a password
The Set Password… command behaves differently depending on whose account it is:
- your own — the current password must be entered;
- someone else’s (an administrator reset) — the current-password field is not shown: the server does not check it, so asking for it would be misleading.
Audit log
The Audit log window is the event journal narrowed to audit events: who did what to accounts, passwords and role membership. Both successful and refused operations are recorded — a log showing only what succeeded cannot answer who tried.
The window is available to administrators only. It carries no acknowledgement controls: an audit entry records what happened, and there is nothing in it to acknowledge.
Databases
The Databases window lists the history databases configured on the server and, for each, its state: Depth (days) — how long values are kept, Items — how many objects write into it, Written values, Write queue, Write latency (µs), and how long event and value cleanup take. A growing write queue means the database is not keeping up with the incoming data.
Object and device parameters point at these databases: an object’s value archive and a device’s event archive are chosen from this list. Configuring the databases on the server side is described under Server.
Formats
The Formats window defines how two-state (discrete) signals look on screen. Each format is a pair of states: “Label 0” and “Label 1” — the texts the states are captioned with — and “Colour 0” and “Colour 1” — the colours they are drawn in. A colour is chosen from the client’s palette by name, not entered as RGB components.
A format is assigned to an object in its parameters (see Data items), so one edit to a format changes every object it is assigned to.
Simulated signals
The Simulated signals window lists the signals the server generates itself, with no device involved. Each carries a Type — the waveform — a Period (ms), a Phase (ms) and an Update interval (ms) saying how often a new value is produced. Simulated signals are used for commissioning and training: they let displays, graphs and alarms be exercised before any equipment is connected.
Nodes
The Nodes mode shows the whole OPC UA address space — from the server’s root folder along hierarchical references — rather than objects and equipment alone. It is available only to an account holding the configure right and, like Administration, is hidden from everyone else.
It is a diagnostic view of the configuration: it shows everything the server publishes, including the service branches that the Objects and Devices panes do not carry. The tree starts at the root folder’s contents — no separate root row is drawn.
Translation status
This English page is a direct translation of the current Russian page.