Architecture
- Overview
- Client-server interaction
- Roles and permissions
- Data objects
- Devices and protocols
- Data acquisition
- Real-time processing
- Calculations and filtering
- System events
- Archiving
- External integration
- Configuration
- Translation status
Overview
Telecontrol SCADA uses a client-server architecture. The central Server collects data from field devices, processes it in real time, stores history, and serves client sessions. The graphical Client and web-based access tools connect over TCP/IP and present data to operators.
The main data flow is:
- Devices send telemetry to the Server using industrial protocols such as MODBUS, IEC 60870-5, and IEC 61850.
- The scanner layer receives and distributes updates into internal channels.
- The real-time subsystem applies reservation, transformations, limit checks, and calculated values.
- Historical services archive value changes and system events.
- Clients display live and historical information and send control commands back to the Server.
Client-server interaction
Clients connect to the Server over TCP/IP on port 2000 by default. Client sessions tolerate short network interruptions and reconnect automatically. Through a single session, the Client can subscribe to live value updates, request historical data, execute control commands, and edit configuration when the user role allows it.
Besides the graphical Client, a Web interface is also available for browser-based access.
Address and port configuration is described in the Server section on client connections.
Roles and permissions
The system supports multiple user roles with different operational and engineering rights:
| Role | Control commands and setpoints | Configuration editing |
|---|---|---|
| Executive / viewer | No | No |
| SCADA engineer | No | Yes |
| Dispatcher | Yes | No |
| Administrator | Yes | Yes |
User rights determine access to control operations, manual value entry, engineering tools, and user administration.
For user setup details, see User configuration.
Data objects
The main information objects are discrete signals, measured values, and control channels. Objects can be identified by number and, optionally, by a unique alias. They can also be archived with a defined history depth.
Objects may be grouped into hierarchical structures that reflect the monitored process layout, for example by plant, substation, or device group.
Object groups
Objects can be organized into object groups, and groups can be nested inside other groups. This allows the system to represent hierarchical structures such as:
Substation
    Feeder
        Metering node
            ...
Redundancy
Each object can use up to two data sources to implement hot standby. If the primary source loses validity, the system switches automatically to the backup source and switches back when the primary source recovers.
An object can also define one control channel. That control channel may even be the same exchange channel that provides the object’s source data.
Incoming values can be:
- inverted for discrete objects
- scaled linearly for measured values
- calculated from a formula
Devices and protocols
The SCADA configuration distinguishes between directions and devices. Directions describe the physical communication channel, such as a serial port or IP endpoint. Devices belong to directions and are identified by the address they use on that channel.
Supported exchange protocols include:
- IEC 60870-5-101
- IEC 60870-5-104
- IEC 61850
- MODBUS RTU
- MODBUS TCP
See the full protocol overview in Protocols.
Information channels
In many cases an information channel is just a single address value, as in IEC protocols. In other cases, especially with MODBUS, the channel specification depends on the protocol and device type.
Examples:
- IEC channels:
1,23,1403 - MODBUS channels:
BOOL:3,UINT16:30020
Information channels also carry a quality state that reflects link status or validity information reported by the device.
Retransmission
Retransmission allows Telecontrol SCADA objects to be forwarded to higher-level systems through supported protocols. This is implemented with a virtual server-side device and a retransmission table that maps SCADA objects to the remote system’s channel addresses.
Retransmission works in both directions: values are sent outward, and incoming control commands can be relayed back to the field equipment.
Data acquisition
The scanner subsystem collects data from field equipment according to the configured directions, devices, and protocols. It also executes control commands, time synchronization, forced polling, and retransmission functions.
If a user edits the configuration of a direction or device, or adds or removes one, the scanner re-establishes or closes the communication channel automatically.
When communication is lost or restored, the scanner logs system events. For operator-side communication monitoring, see Device watch.
Real-time processing
The real-time subsystem receives raw equipment data from the scanner and distributes it to system objects. It calculates quality, handles source redundancy, computes formulas and emulated values, and notifies clients about object updates. In the reverse direction, it routes user commands back to the scanner for execution.
When the Server restarts, the real-time subsystem restores the latest object values from history.
It also supports out-of-order values: data that belongs to an earlier timestamp than already received data is still processed and archived correctly.
Quality flags
Object values carry quality flags that are commonly displayed next to the current value:
| Flag | Meaning |
|---|---|
K | Not configured or configuration error |
C | No communication |
H | Connection error or invalid expression |
P | Manual input |
2 | Backup channel |
B | Blocked channel |
U | Stale value |
V | Limit violation |
Manual input and blocking
An operator with control privileges can manually set the value of any discrete or measured object with the Manual input command.
At the same time, the operator can block the object. When blocked, incoming telemetry from field devices is ignored and the manually entered value takes priority. When the block is removed, the next device update overwrites the manual value again.
Limit checks
Measured objects can define limit monitoring with alarm and pre-alarm threshold pairs. Each pair has an upper and lower boundary.
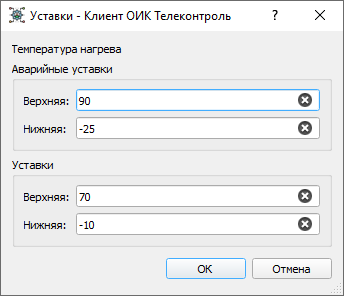
When a discrete object changes state, the real-time subsystem logs a system event. For measured objects, entering or leaving a limit range also generates events.
When a measured object with configured limits is displayed in a Graph, the limits are shown as dashed lines:
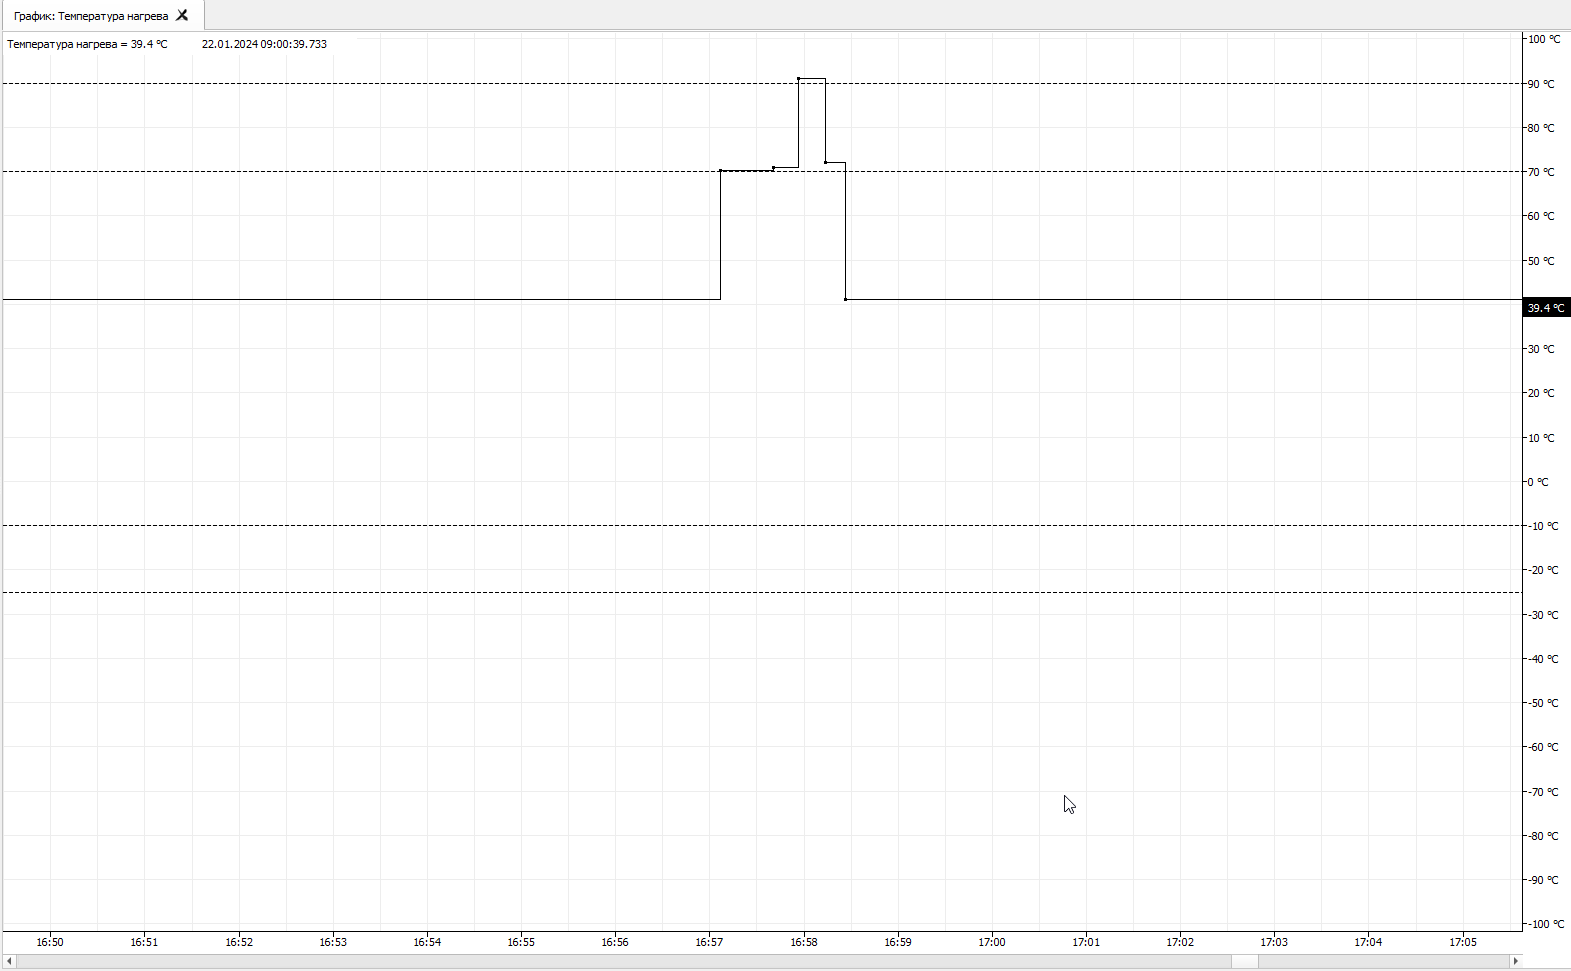
Calculations and filtering
Formulas
Any SCADA object can use a mathematical expression, also called a formula or calculated value, as its data source. Expressions can include arithmetic operators, references to other objects by alias, and built-in functions.
See the full syntax in Formulas.
Emulation
For project preparation and testing, objects can use emulated signals instead of real equipment. The data is generated by one of the predefined functions configured as simulated signals.
Aperture
For measured objects, aperture filtering suppresses small value changes. Any deviation smaller than the configured aperture is ignored.
Deadband
The deadband suppresses small measured values around zero. Values whose absolute magnitude is smaller than the configured deadband are forced to zero.
Stale detection
An object can define a stale-data interval. If the value is not updated within that interval, the real-time subsystem marks it with the stale flag.
System events
A SCADA system event is a record whose main fields are event time and message. Newly registered events remain unacknowledged until a user acknowledges them, and acknowledgement is system-wide.
If an event belongs to an object, the event also references that object. Typical object-related events include:
- discrete state changes
- measured-value limit transitions
- manual input and blocking
- block removal
- steps in a control-command workflow
Some events are associated with devices instead, for example:
- communication loss and restoration
- device restart, reconfiguration, or removal
Events are reviewed in the Event journal.
Archiving
The archive subsystem stores historical object values and system events in one or more SQLite databases. This database engine is built into the Server, so no third-party database system is required.
Archived history can then be queried and displayed in the Graph, Data, and Summary views.
See also the Server section on historical databases.
External integration
OPC UA server
The SCADA Server can act as an OPC UA server and expose its address space to external systems. External OPC UA clients can access current values, historical data, and subscriptions.
Configuration is described in the Server section on OPC UA.
OPC client on Windows
On Windows, the Server can also connect outward to Classic OPC (OPC DA) servers. Their tags then appear in the Telecontrol SCADA address space and can be bound to SCADA objects.
Configuration is described in the Server section on OPC client.
Configuration
The configuration stored on disk contains all SCADA objects, equipment structure, and users. It is updated immediately when edited so that changes are reflected across the running system without waiting for a manual save step.
Configuration is edited with the built-in engineering tools. The default template configuration created on first installation includes the root user with an empty password.
For more details, see Development and Excel.
Translation status
This English page is now a functional architectural reference. The Russian page still contains fuller low-level examples and some extra terminology detail.