Summary
For one object or multiple objects, the client can open a Summary table:
Columns can be added or removed through the object panel by toggling the selected objects.
The Summary table is limited to 10,000 rows and 1,000 columns.
When the Graph or Data command is launched from the Summary context menu, the selected object and time interval are reused.
Cells are shown in gray while historical data is still being requested from the Server. As data arrives on the client, the cells become white. If no archived data exists for the requested interval, the cell remains empty.
Aggregation interval
The row interval can be changed using preset periods:
- 1 minute
- 5 minutes
- 15 minutes
- 30 minutes
- 1 hour
- 12 hours
- 1 day
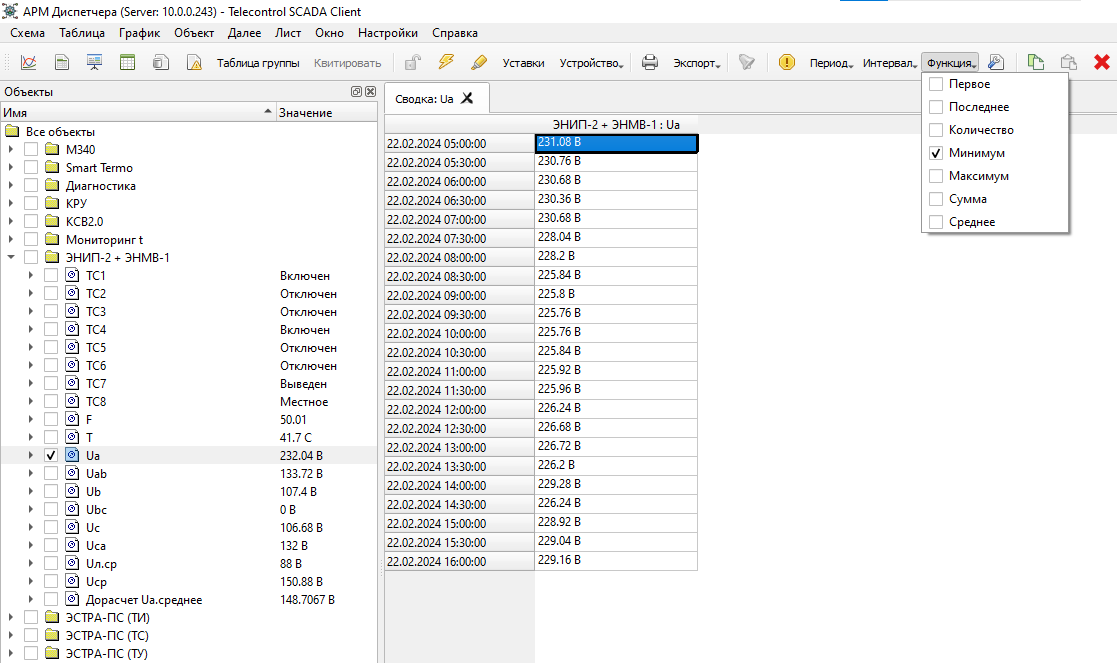
Aggregation function
The summary can calculate values using these aggregation functions:
- Count
- Start
- End
- Minimum
- Maximum
- Sum
- Average
Translation status
This English page matches the current scope of the Russian page, which is also brief.