Device watch
The device watch window shows the data exchange with the selected device in real time.
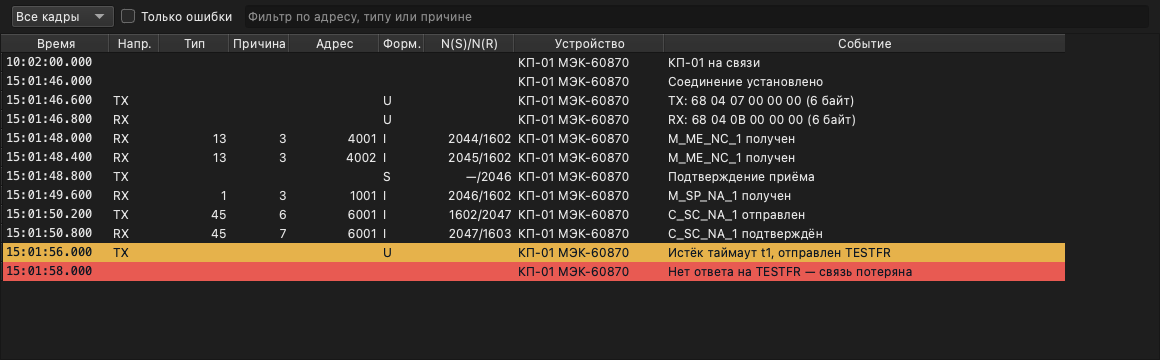
To open the window, select a device in the Hardware panel and choose Watch
from its context menu (right mouse button) or from the Item menu.
Two modes
The window answers two different questions about one device, and has a mode for
each. The Frame trace context-menu item switches between them; in trace mode
the window title gains “— Frame trace”, so the tab says which one is open.
- Device log
- Everything the device reported, as logged. The default mode.
- Frame trace
- Protocol traffic only — the lines the driver marked as traffic — with a decode pane for the selected frame beside the table.
The table
| Column | Description |
|---|---|
| Time | Event timestamp |
| Dir | Direction: RX received, TX sent |
| Type ID | ASDU type identifier |
| Cause | Cause of transmission |
| IOA | Information object address |
| Fmt | Frame format: I, S or U |
| N(S)/N(R) | Send and receive sequence numbers |
| Device | Device identifier |
| Event | Description of the communication event |
The decoded frame fields — Type ID, Cause, IOA, Fmt and N(S)/N(R) — are blank for ordinary log lines. The column set is the same in both modes, because knowing which log lines are protocol traffic is useful in the log as well.
Events are shown in chronological order. New events are appended to the bottom of the table, which scrolls to the latest event while the last row is the selected one.
Filter
A filter bar sits above the table. It applies in both modes, and it narrows not
only the visible rows but also what Save as writes.
- Frame format
- "All frames", "I-format" — the frames that carry an ASDU, that is the data itself — or "S/U-format", the acknowledgements and link control. The latter two are grouped because neither carries data and both matter for the same question: why the link is not moving.
- Errors only
- Keeps warnings and worse — usually the reason the window was opened at all.
- Search field
- A substring matched against every column: address, type, cause, the sequence numbers and the message text.
Frame decode
In trace mode a decode pane for the selected frame sits to the right of the table. It shows:
- a header naming the selected frame (direction, time and a short summary)
- every captured octet of the frame, in hexadecimal
- the decoded field tree, with the columns Field, Offset and Value — the APCI, the ASDU and the information objects. Offset says which byte of the frame carried the field.
The pane decodes the frame’s own octets rather than the fields the server already extracted: byte offsets are the point of the pane, and a pane echoing the server’s reading could not show the two disagreeing.
The decode is deliberately tolerant: a truncated capture, an unknown type identifier, or a driver that is not IEC 60870-5-104 degrades to showing the raw octets rather than failing or guessing.
Below the tree, a Mapped node group resolves the object addresses found in the frame against the address space, giving each one the signal’s name and its node identifier. An address that is not in the device’s address map is marked as such — so it is visible that something arrived from the device and is bound to nothing.
Pause, save and clear
The window’s context menu carries:
- Pause
- Suspends the event stream; the window title is marked while it is paused.
- Save As…
- Writes the log to a file. What is visible is what is written — the filter applies to the save as well.
- Clear
- Empties the table.
The number of displayed events is limited to 10,000 entries. When the limit is reached, older records are removed automatically.
Translation status
This English page is a direct translation of the current Russian page.